 In the vast expanse of financial markets, where fortunes are made and lost in the blink of an eye, understanding the intricate language of candlestick patterns is akin to possessing a master key. These patterns, comprised of various shapes and configurations, serve as the Rosetta Stone for traders, providing deep insights into market sentiment, psychology, and potential price movements. In this extensive exploration, we will unravel the layers of candlestick patterns, decoding their significance, understanding their applications in the foreign exchange (FX) market and other financial domains, and delving into the nuanced art of making informed decisions based on these patterns.
Decoding the Candlestick Patterns: A Language of Market Behavior
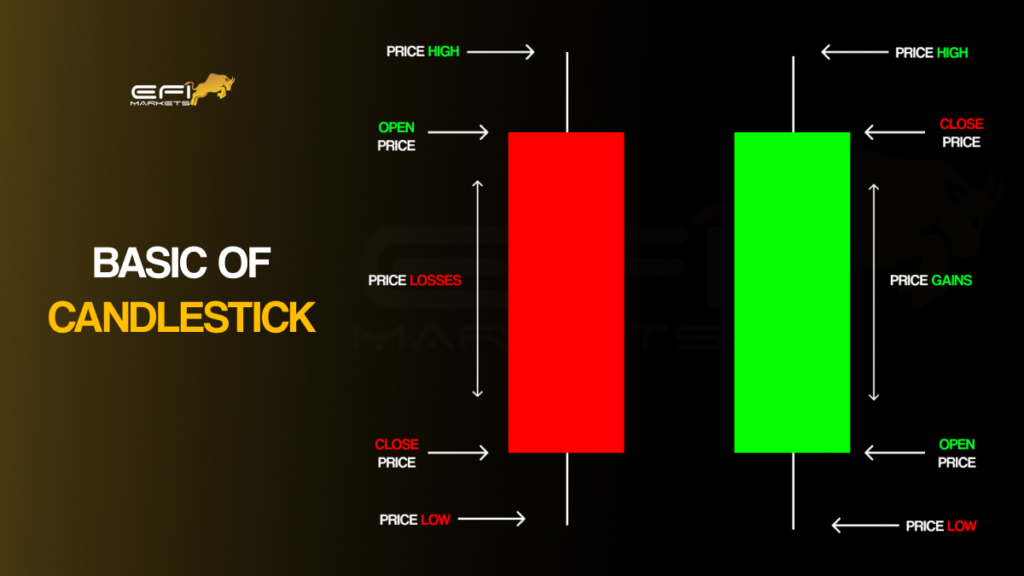
Candlestick patterns, an essential facet of technical analysis, are visual representations of price movements within a specified timeframe. Every candlestick consists of four primary components: the open, close, high, and low prices. By comprehending the interplay of these elements, traders can decipher the market’s mood and anticipate potential shifts.Components of a Candlestick:
- Body: The body, either filled or empty, represents the price range between the open and close. A filled (or solid) candle, often colored red or black, signifies a bearish market sentiment, where the close price is lower than the open. Conversely, an empty (or hollow) candle, typically depicted in green or white, denotes a bullish sentiment, indicating that the close price is higher than the open.
- Wicks (or Shadows): Thin lines extending above and below the body indicate the high and low prices within the specified timeframe. These wicks illustrate the price range and volatility during that period.
How to Read a Candlestick Pattern:
- Single Candle Patterns:
- Doji: This pattern signals market indecision, occurring when open and close prices are nearly identical. A doji suggests that neither buyers nor sellers have a clear advantage, potentially leading to a reversal or continuation of the existing trend.
- Hammer: A bullish reversal pattern, the hammer appears after a downtrend, indicating potential price increase. It has a small body near the high and a long lower wick, suggesting that sellers were initially dominant but lost control, leading to a bullish reversal.
- Shooting Star: This bearish reversal pattern is the opposite of a hammer. It occurs after an uptrend, indicating potential price decline. The shooting star has a small body near the low and a long upper wick, suggesting that buyers were initially in control but lost momentum, leading to a bearish reversal.
- Multi-Candle Patterns:
- Engulfing Pattern: A powerful reversal signal, the engulfing pattern occurs when a larger candle engulfs the previous smaller one. A bullish engulfing pattern forms at the end of a downtrend, indicating a potential upward reversal, whereas a bearish engulfing pattern at the end of an uptrend suggests a potential downward reversal.
- Morning Star and Evening Star: These multi-candle patterns are potent indicators of market shifts. The morning star, a bullish reversal pattern, forms after a downtrend and consists of three candles: a large bearish candle, a small candle with a gap down, and a large bullish candle. Conversely, the evening star, a bearish reversal pattern, forms after an uptrend and comprises three candles: a large bullish candle, a small candle with a gap up, and a large bearish candle.
Foreign Exchange (FX) Candles vs. Other Markets’ Candles
While the fundamental principles of candlestick patterns remain constant, subtle differences exist, especially in the dynamic realm of the foreign exchange market:
- 24-Hour Trading: The FX market operates 24 hours a day, spanning different time zones and global financial centers. This continuous trading leads to unique candlestick patterns that provide a more comprehensive view of market dynamics. Traders in the FX market have the advantage of a continuous flow of information, allowing them to analyze longer and more varied candlestick patterns.
- Liquidity Impact: The FX market is the most liquid financial market globally, with an average daily trading volume in trillions of dollars. This high liquidity results in smoother price movements, making certain candlestick patterns, such as doji and engulfing patterns, more reliable indicators of market shifts. In illiquid markets, these patterns might not be as dependable due to erratic price movements caused by low trading volumes.
- Impact of Economic Indicators: Economic indicators, such as employment reports, GDP data, and central bank decisions, have a significant impact on currency values in the FX market. Candlestick patterns in the FX market often react sharply to these indicators, creating unique and pronounced patterns that reflect market sentiment based on economic events.
The Art of Informed Decision-Making: Balancing the Factors
Making decisions based on candlestick patterns involves a delicate balance of technical analysis, market knowledge, and intuition. Traders must consider a multitude of factors, including historical price data, volume trends, support and resistance levels, and external market influences. Moreover, understanding the psychological aspects of market participants is paramount. Emotional responses and herd mentality often drive market movements, leading to the formation of specific candlestick patterns.The Challenge of Balance and Expertise: Navigating the Complex Terrain
Trading is not merely a science but an art form that demands creativity, adaptability, and a deep understanding of human behavior. Traders face the challenge of balancing various factors and indicators, each offering unique insights into market dynamics. Technical analysis, which includes candlestick patterns, is just one facet of trading. Fundamental analysis, encompassing economic indicators, geopolitical events, and market news, provides the broader context within which candlestick patterns unfold. Successful traders master the art of synthesis, integrating various forms of analysis to make well-informed decisions. Additionally, the challenge lies in adapting to different market conditions. Financial markets are in a constant state of flux, shifting between trending and ranging phases. What works in a trending market might fail in a ranging one. Traders need the expertise to identify these market phases and adjust their strategies accordingly. This adaptability is key to navigating the ever-changing landscape of financial markets successfully.The Psychology of Market Participants: Understanding the Human Element
Beyond the mathematical precision of candlestick patterns lies the intricate realm of human psychology. Markets are not driven solely by economic indicators or corporate performance but by the collective emotions, fears, and aspirations of traders. Understanding these emotional currents is essential for interpreting candlestick patterns accurately.- Fear and Greed: Market participants are often driven by fear and greed. Greed fuels buying frenzies, leading to bullish patterns, while fear triggers sell-offs, resulting in bearish patterns. Candlestick patterns, especially those signaling reversals, often reflect these emotional extremes.
- Herd Mentality: Traders tend to follow the crowd, leading to the formation of specific candlestick patterns. A sudden surge in buying or selling can create momentum, generating patterns like engulfing patterns or hammers. Recognizing these patterns early allows astute traders to anticipate market movements.
- Confirmation Bias: Traders may interpret candlestick patterns based on their preconceived notions, leading to confirmation bias. This psychological tendency to search for, interpret, favor, and recall information in a way that confirms one’s beliefs can influence how traders perceive and act upon candlestick patterns.